From Experience: Cost Trends Edition
In This Issue:
The following cost trends are included in this issue:
- U.S. Construction Costs
- Leading Indicators of Construction Industry
- Construction Spending
- Construction Backlog Indicator
- Construction Employment / Unemployment Rates
- Construction Labor
- Material Inflation
- 7.1 Asphalt Pavement
- 7.2 Concrete
- 7.3 Structural Steel
- 7.4 Stainless Steel
- 7.5 Copper
- 7.6 Pipe
See this reference sheet to learn more about each of these sections, or, for more information relating to this Hixson Cost Trends newsletter, please contact Mike Downing at the information below.
Current Trends
Welcome to the Spring 2026 issue of Cost Trends from Hixson!
Over the past year, non‑residential construction activity has often been characterized as a tale of two divergent sectors, resulting in net negligible growth. On one side are sectors experiencing rapid expansion, including data centers, logistics facilities, AI‑driven infrastructure, electrical power infrastructure, and select healthcare and education markets. On the other side are most of the remaining non‑residential sectors, which have generally seen minor to moderate slowdowns in growth.
Construction inflation had been gradually trending back toward typical norms until recent volatility in global energy markets disrupted that trajectory. The rapid increase in oil prices following the closure of the Strait of Hormuz – through which approximately 20% of the world’s oil supply moves – has introduced new cost pressures across the construction industry. Over time, higher oil prices are expected to drive increases in transportation costs and costs for oil‑based construction materials, such as asphalt paving, PVC piping, plastics, petrochemical‑based sealants, and roofing membranes. Energy‑intensive materials such as steel, cement, copper, nickel, stainless steel, and aluminum are also experiencing notable price increases.
The full impact of these increases remains uncertain, as higher energy costs take time to work through supply chains. As a result, both the duration and magnitude of oil price volatility are still unknown. Once oil prices stabilize and return to more typical levels, we anticipate prices of oil-based construction products will return, in time, to their normal levels. Amid these conditions, there is growing discussion around the potential for reduced demand long-term, or even permanently, due to high prices and supply shortages, and an increased risk of recession should elevated oil prices persist for an extended period.
At the same time, skilled labor shortages continue to present significant challenges, particularly in busy regions, with mechanical, electrical, and specialty trades being most affected.
Long lead times also remain a critical planning concern, especially for large electrical distribution and generation equipment. More recently, and perhaps surprisingly, we have heard that even some common structural steel shapes have reported lead times extending to as long as 36 weeks, compared to the typical 8-12 weeks.
To address these concerns, Owners may want to consider some of the following strategies to mitigate risk:
- Prioritize early planning and long‑lead identification by confirming critical long‑lead items as early as 30% design and pushing key project decisions earlier to support timely procurement and coordination.
- Accelerate procurement, vendor engagement, and contracting through early vendor negotiations, aggressive long‑lead purchasing during preconstruction, earlier vendor buyouts to lock pricing and manufacturing slots, and expedited contractor prequalification and contractor awards.
- Manage material price volatility by securing firm pricing quotes from vendors, incorporating commodity escalation clauses, and monitoring material pricing regularly to support live adjustments.
- Evaluate prefabricated or modular solutions where labor availability or schedule certainty is at high risk. Keep in mind for modular systems, that offsite construction methods (which are on the rise to reduce onsite labor and schedule risk) require earlier coordination and decision-making as well as planning for connection details.
- Adopt budgets with clear limits and share those expectations with design partners. Owners may also wish to conduct more robust master planning and early design activities to develop working project budgets sooner. This will enable early procurement of long-lead items and engagement of contractors, to enable earlier procurement and lock‑in resources and mitigate risk.
- Allow for greater flexibility by using design options in response to changing market conditions, recognizing that these choices may involve tradeoffs between cost and schedule priorities. In addition, consider requiring earlier and more frequent cost estimates and market updates from design and construction partners, along with carrying higher contingencies where appropriate.
In this environment, Owners benefit from a clear, current view of construction cost conditions. The next section offers specific, up‑to‑date insights into material, labor, and market pricing trends.
1. U.S. Construction Costs continue to rise, with material costs outpacing overall construction costs in 2026.
For March 2026, the annual Construction Cost Index (CCI) as reported in Engineering News Record (ENR) increased +2.7%, Building Cost Index (BCI) increased +4.3% and Material Cost Index increased +5.8%. In February 2026, the All-Items Consumer Price Index increased +2.4% over the last 12 months. The RLB Construction Cost Index 1st Quarter 2026 annual increase was +4.4%. Turner’s Building Cost Index represents a +4.1% yearly increase through December 2025. Per ENR’s Cost Indexes by City for March 2026, cities with the highest annual construction cost increases were Chicago +7.9%, New York City +6.0%, Dallas +5.8%, Minneapolis +5.2%, and Baltimore +5.1%. Cities showing decreases included Seattle -2.3%, Los Angeles -0.8%, and Atlanta -0.1%.
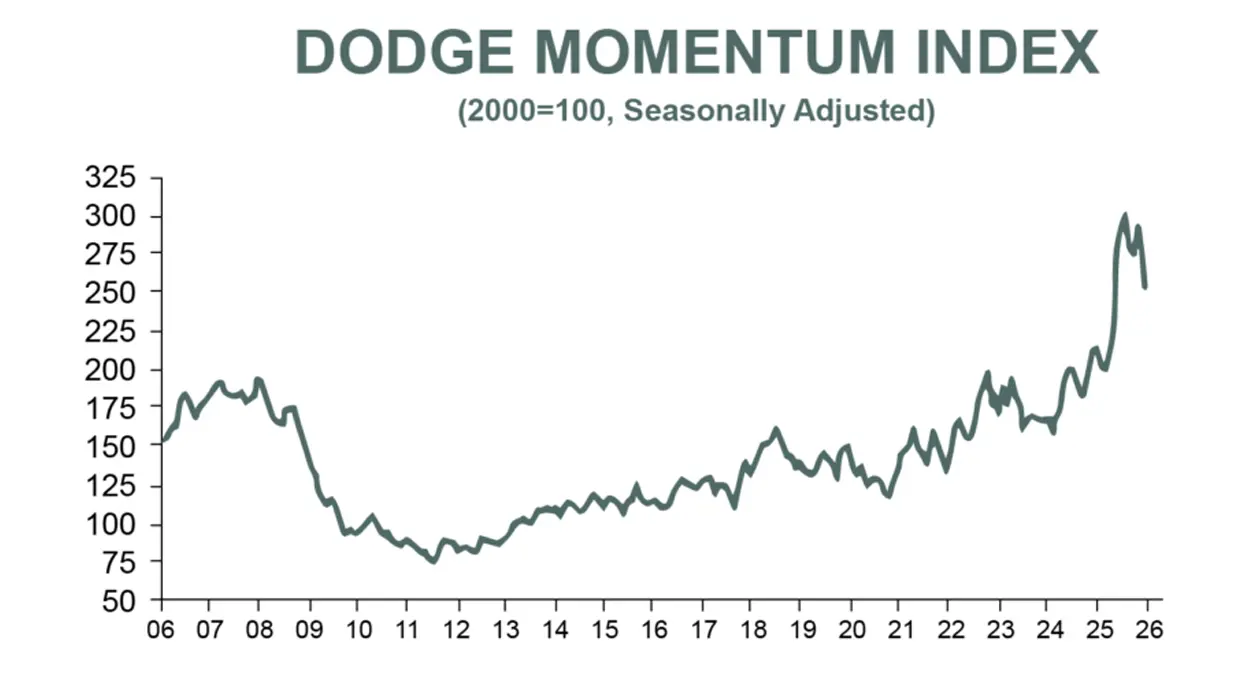
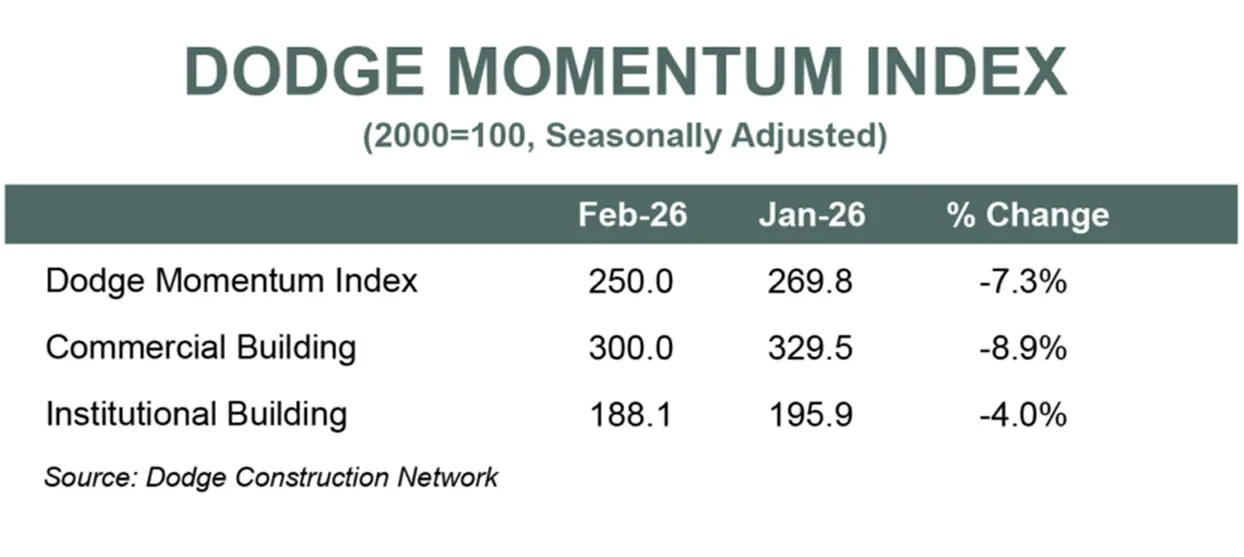
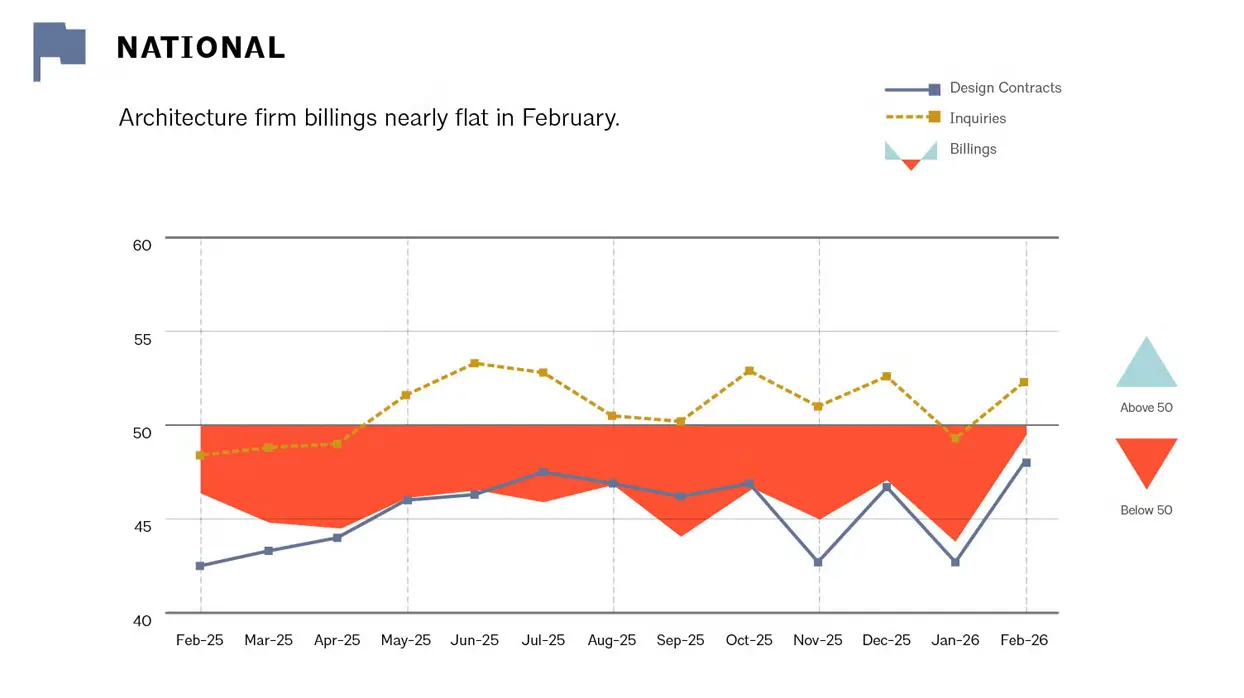
2. Leading Indicators of Construction Industry show near-term softening as Dodge Momentum pulls back while ABI remains below 50.
At 49.4, the Architecture Billings Index (ABI) for February 2026 remained below 50 (a level which indicates a slowdown). The seasonally adjusted Dodge Momentum Index decreased -7.3% per month in February 2026 to 250.0. The Dodge Commercial Building Index was -8.9% and Institutional Building Index was -4%. For the full year, the Dodge Momentum Index is +18.7% in February 2026 from a year ago.
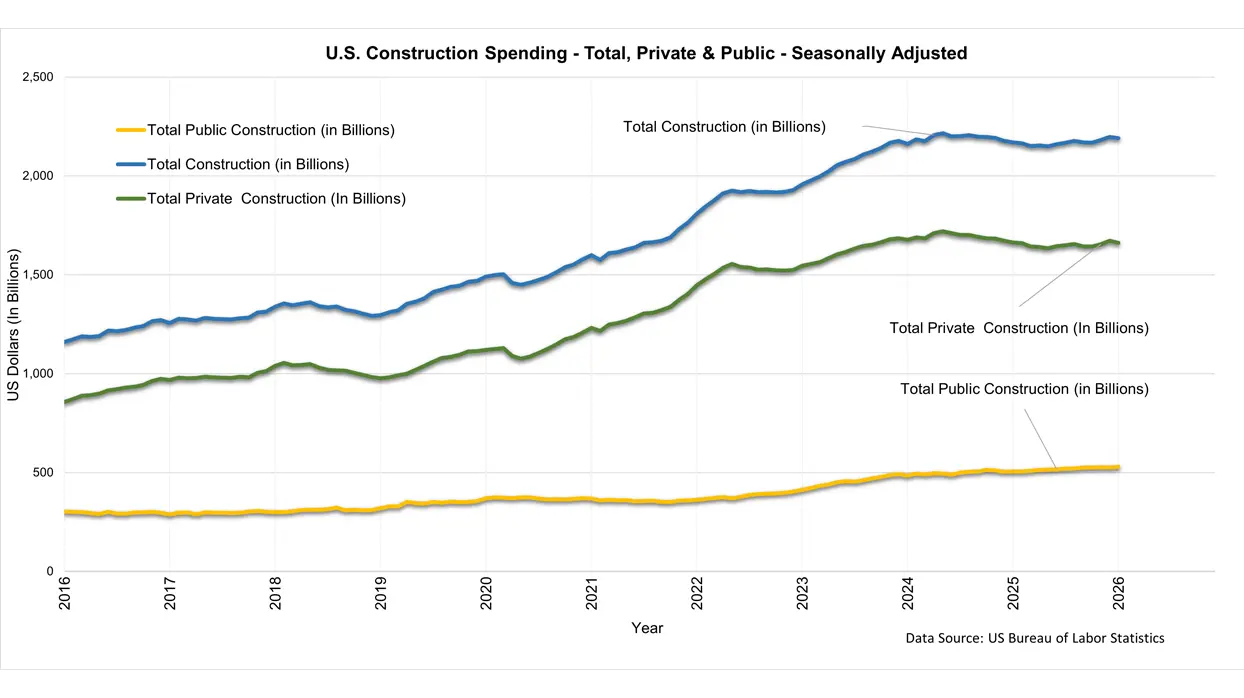
3. Total and Private Construction Spending remains near record levels, with total spending up about 1.0% year-over-year and private spending essentially flat.
According to the U.S. Census Bureau, total construction spending in January 2026 was $2,190.4 billion, which is 1.0% higher than a year ago. Total private construction spending in January 2026 was $1,661.2 billion, which is -0.1% lower than a year ago.
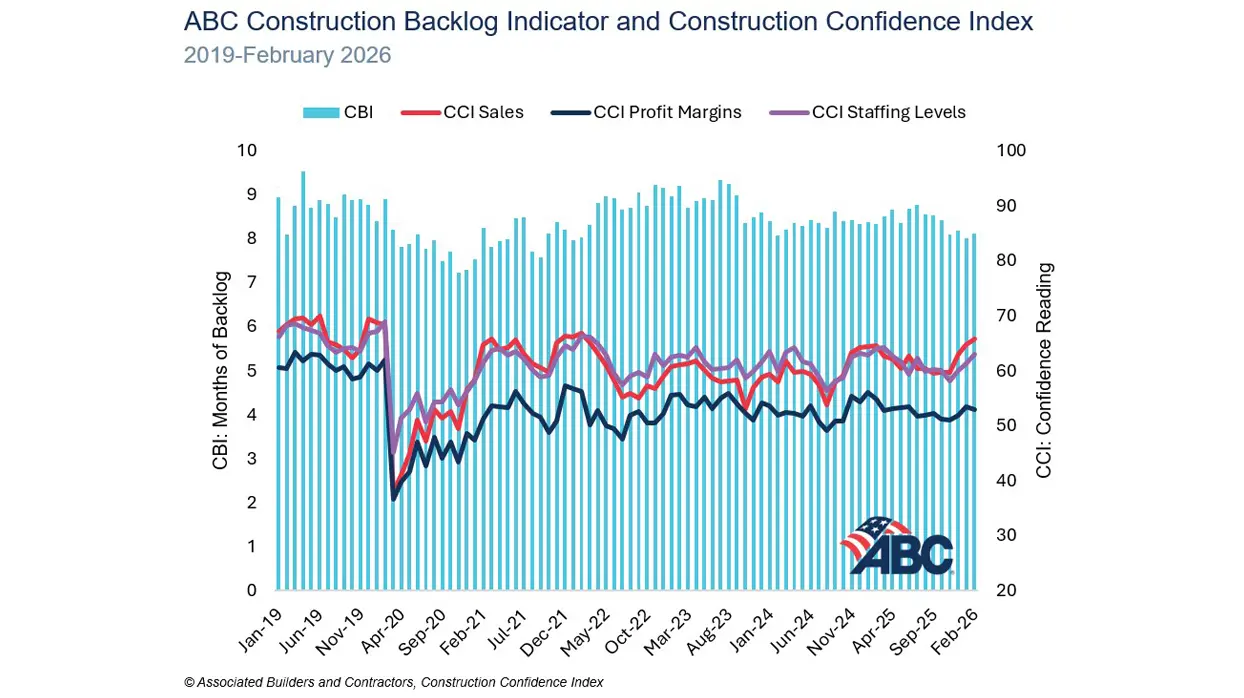
4. Construction Backlog Indicator (CBI) is holding near 8.1 months, indicating contractors remain busy.
Average CBI for February 2026 is 8.1 months, which is slightly higher than January 2026 at 8.0 and slightly lower than February 2025 at 8.3.
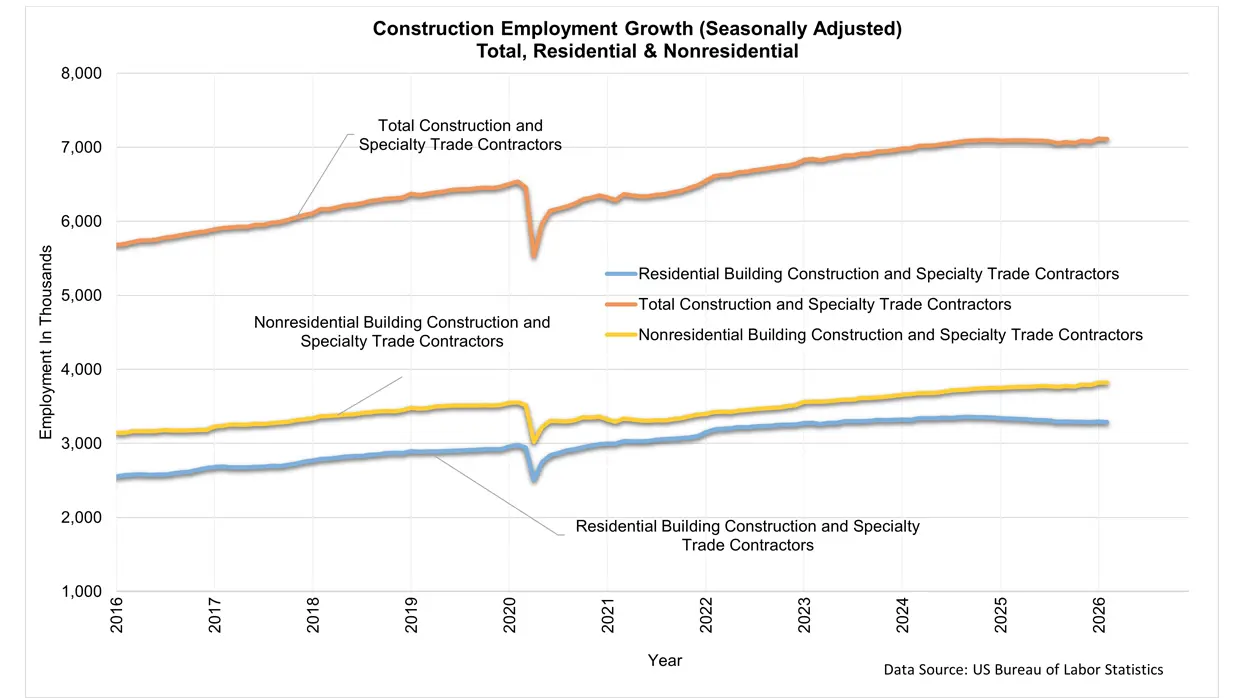
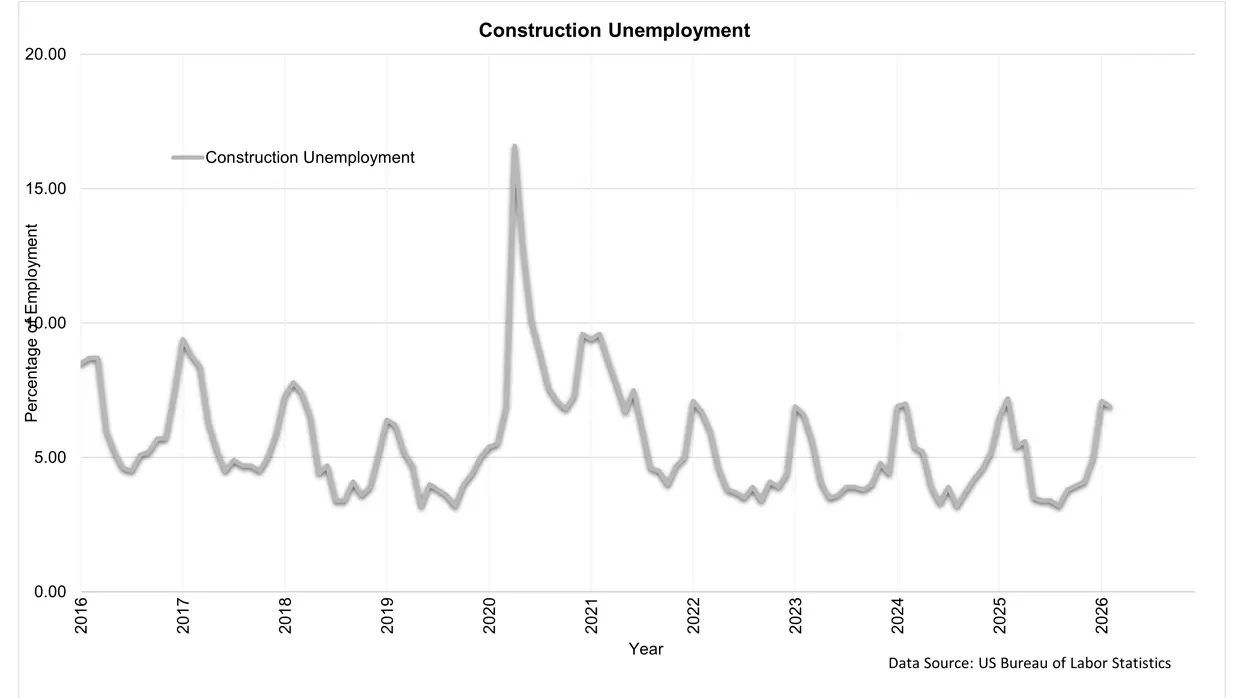
5. Construction employment softened slightly, while unemployment remains elevated compared to historical lows.
Total construction employment declined by approximately 11,000 jobs in February 2026. Total construction employment currently stands near 8.31 million workers. Construction unemployment increased to approximately 6.9% in February 2026, remaining above recent cyclical lows and reflecting easing labor demand and project completion on several federally funded programs.
6. Construction Labor costs continue to rise, led by skilled labor increases in select markets.
Per ENR’s Cost Indexes by City for March 2026, annual skilled labor costs rose as high as +14.7% in Seattle and were also elevated in Cincinnati (+9.8%), and Philadelphia (+6.3%). Common labor costs increased most notably in Chicago (+9.2%), New York City (+3.5%), and Cincinnati (+3.4%), with many markets remaining flat.
7. Construction Material prices were mixed in 2025: Core materials remain relatively stable, while energy, metals, and steel products increase.
According to Gilbane’s 2025 Q4 Construction Market Conditions Report, year‑over‑year material price changes through August 2025 show mixed results. Ready‑mix concrete prices were flat, while concrete pipe increased +3.9%, lumber and plywood increased +4.8%, and paving mixtures rose slightly by +0.3%. At the same time, energy, metals, and steel products experienced increases, with #2 diesel fuel up +8.2%, steel mill products up +13.1%, fabricated structural steel up +7.6%, steel pipe and tube up +4.1%, aluminum shapes up +22.8%, copper and brass shapes up +4.9%, and flat glass up +3.9%.
7.1 Asphalt Pavement prices eased year-over-year per BLS, while ENR shows a slight annual increase.
According to the U.S. Bureau of Labor Statistics (BLS) , asphalt paving prices for February 2026 are -0.1% from a month ago and -2.1% from a year ago. According to ENR, asphalt paving prices for March 2026 are -1.5% from a month ago and +1% from a year ago.
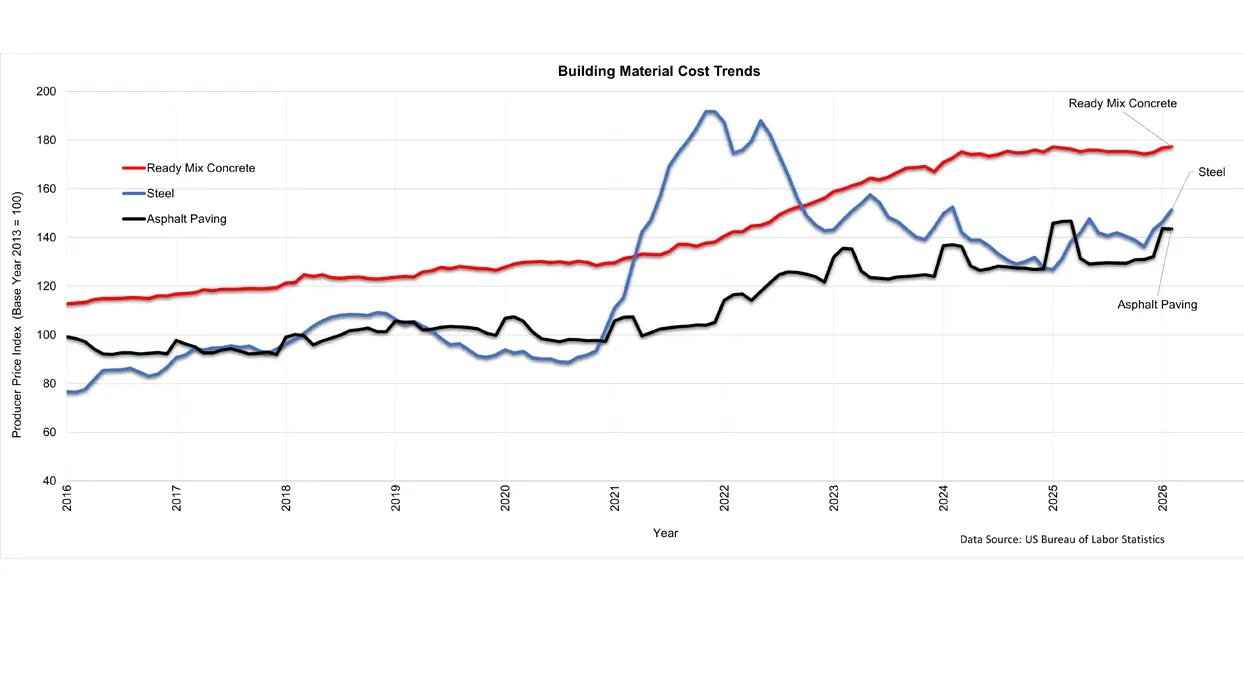
7.2 Concrete prices continue to rise at a gradual pace, and Reinforcing Steel is up sharply year-over-year.
According to the BLS, ready-mix concrete prices are +0.3% from a year ago as of February 2026. According to ENR, reinforcing steel prices increased +20.6% from a year ago as of March 2026.
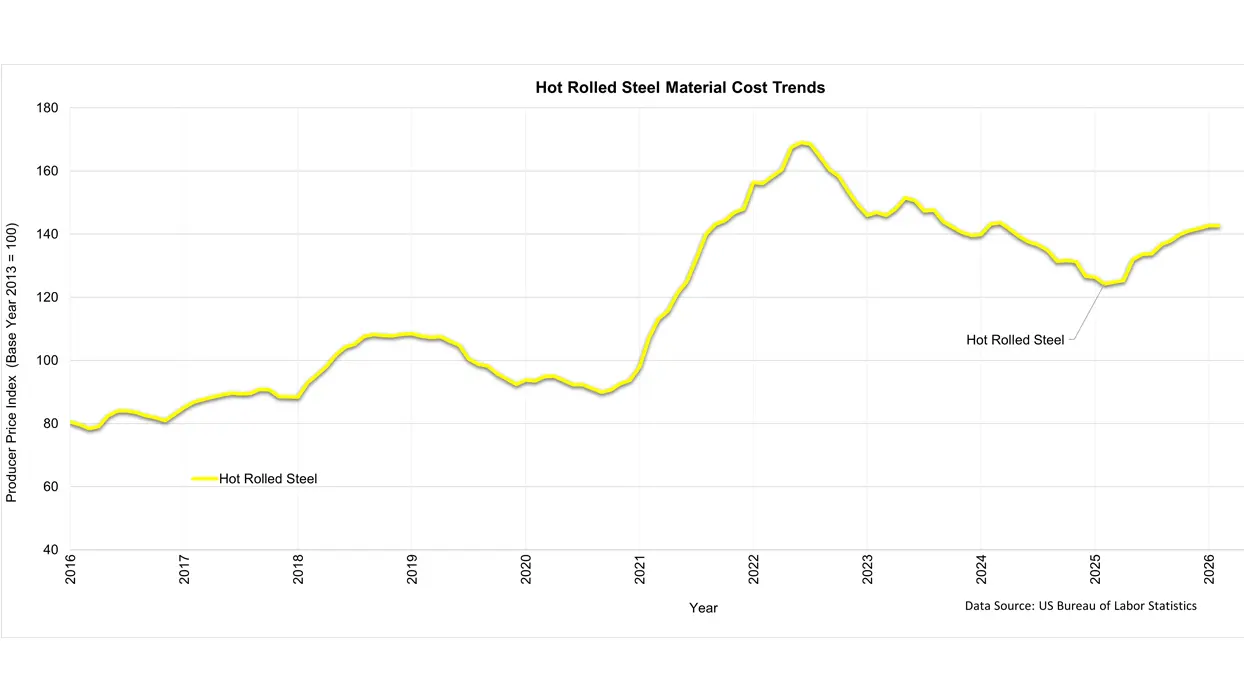
7.3 Structural Steel prices rebounded in early 2026 after prior declines.
Per BLS, hot‑rolled steel prices increased +14.8% year‑over‑year, though monthly pricing remained flat in February 2026. ENR reports wide‑flange steel prices up approximately +12.1% annually for March 2026.
7.4 Stainless Steel sheet and plate prices rose at an elevated pace year-over-year.
Per the ENR 20-City Average, stainless steel sheet prices increased +11.3% and stainless steel plate increased +23.8% year-over-year as of March 2026.
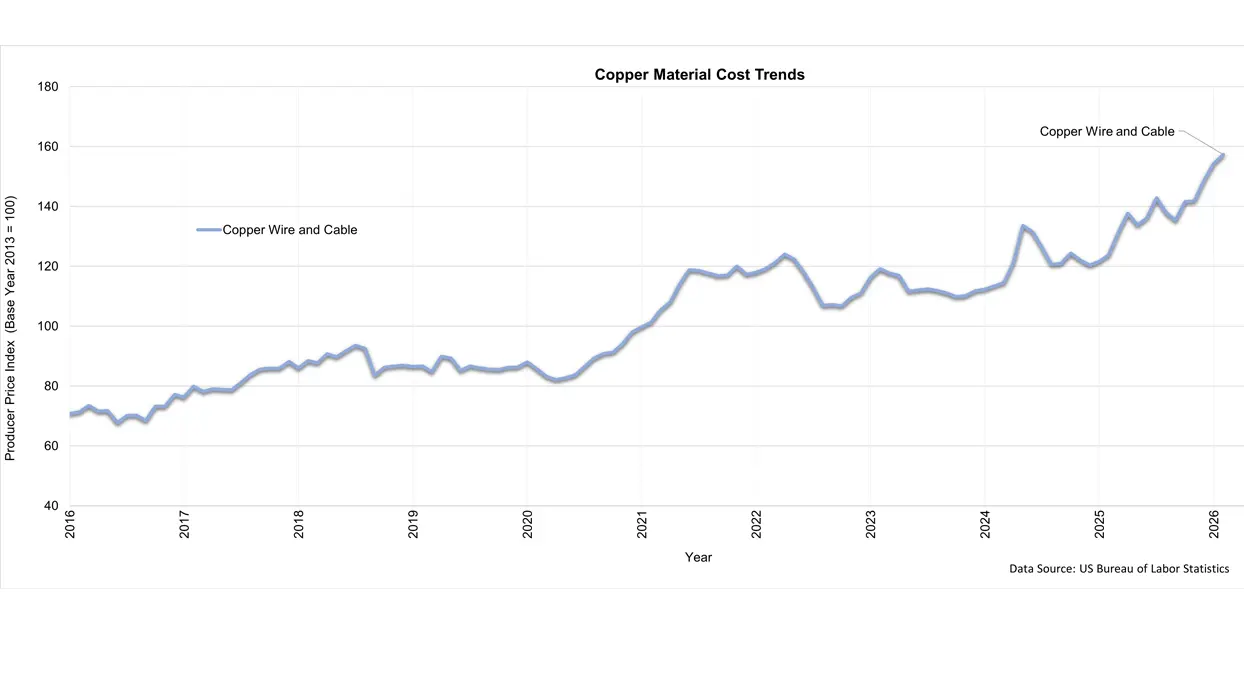
7.5 Copper tubing prices remain elevated and increased year-over-year per ENR.
ENR’s 20-City Average shows copper water tubing is up +18.8% for 0.5” Type L and +28.3% for 1.5” Type L compared to a year ago as of March 2026.
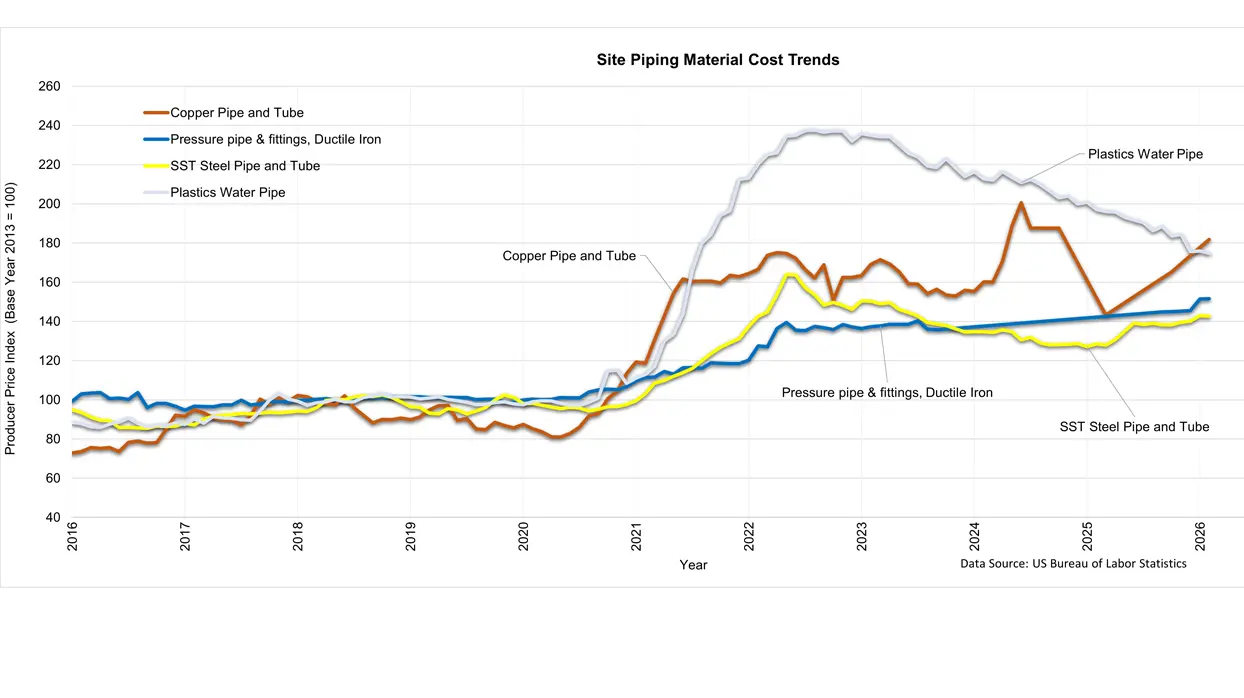
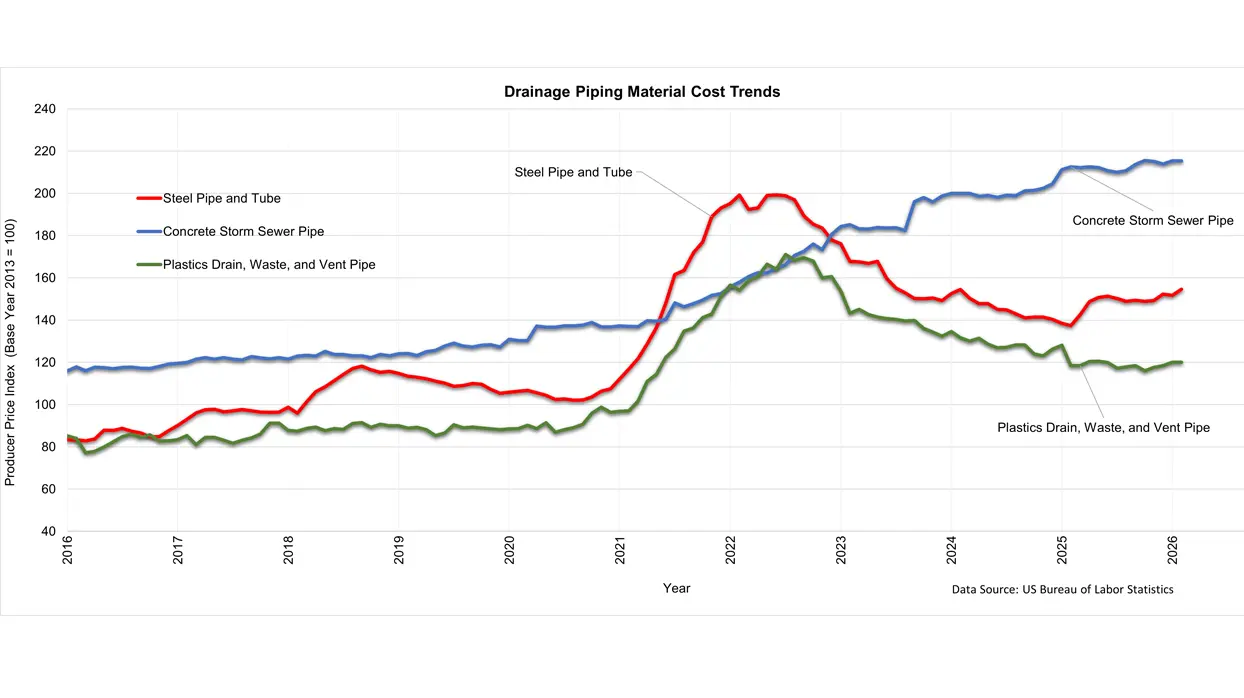
7.6 Pipe prices remain elevated, with wide divergence by material type.
Based on ENR Annual 20‑City Averages for March 2026:
- Corrugated steel pipe:
- 12″ up +5%, 36″ up +7.4%, 60″ up +8.7%
- Ductile iron pipe:
- 6″ up +10.8%, 8″ up +10.0%, 12″ up +11.8%
- Reinforced concrete pipe:
- 12″ up +8.9%, 24″ up +9.9%, 36″ up +6.5%, 48″ up +2.8%
- PVC sewer pipe:
- 4″ down ‑2%, 8″ down ‑2.2%
- PVC water pipe:
- 6″ up +25%, 8″ up +11.1%, 12″ up +16.4%
BLS PPI indices show plastic water pipe down ‑0.5%, steel pipe and tube down ‑11.3%, and concrete pipe down ‑1.3% softening year‑over‑year for February 2026.
About This Newsletter
The From Experience Cost Trends edition is a publication created by the Hixson Cost Estimating department. Having a professional in-house estimating department is distinctive in design/engineering firms and enables Hixson to fulfill our commitments to design/engineer a project to an agreed-upon cost, by knowing our clients, their projects, and the areas where those projects are built. Because Hixson consistently works on projects throughout North America, we have up-to-date information on prices and conditions that affect our work.
- American Institute of Architects
- Associated Builders & Contractors, Inc.
- Associated General Contractors of America
- Compass International Reports
- Commodity Online
- Construction Connect
- Contractor, Endeavor Business Media
- Danis
- Deloitte Consulting
- Dodge Data & Analytics
- Engineering News Record
- FMI Corporation
- Gilbane Building Company
- IHS Global Insight
- Kitco
- Miles McClellan Construction
- Portland Cement Association
- Rider Levett Bucknall Consultants
- S. Means, Quarterly Cost Round-up
- Turner Building Cost Index
- U.S. Bureau of Labor Statistics (BLS)
Continuing Education
Hixson associates regularly participate in continuing professional education events across the country. Recent construction site visits to Hixson projects, participation in professional organizations, and industry events attended by Hixson’s Cost Estimating Group – all of which help inform our cost estimates – include:
- 2026 ASPE: The Estimator’s Edge: Will U.S. Construction Thrive or Dive in ‘26?
- 2026 Gordian: Construction Cost Trends Webinar
- 2026-2027 Architecture + Design Master: U.S. Construction Market Outlook
- 2025 Hixson Project Essentials: Cost Estimating Presentation to Hixson Associates
- 2025 Construction Cost Trends by Gordian
- 2025 Construction Economy Outlook by ConstructConnect
- Monthly Meeting Presentations of ASPE (American Society of Professional Estimators), AACE (Association for Advancement of Cost Engineers), ACI (American Concrete Institute), CSI (Construction Specifications Institute)
- ASPE Chapter Certification Committee Chairman
- AACE Section Treasurer/Past President & Secretary
Sign Up For More Insights
Connect with the latest industry trends and insights with our newsletters. We provide the knowledge that powers the future.
Subscribe now